Home • Help • CSV samples • Industrial solutions • About
![]()
T2T-PID is a powerful simulator that allows you to model your processes and visualize the impact of changes to your PID controller on the performance of your control loop.
You need to configure the simulator with the parameters of your process. Maybe you know its characteristics, or you can estimate them with the help of recorded data from a CSV file. A graphic tool will assist you with the definition of your process.
You can then enter PID area and try out different settings for your controller and observe the performance. Different controller schemes and advanced modeling parameters (noise and filter) allow you to realistically model your processes.
The defining elements of a stable process are its gain, the delay of the action on the measure and the response time. You can enter these values directly. But you can also establish the gain by graphically indicating what gain in measure is obtained by what span of command....
A similar operation is required for the integrating process. Apart from its inherent delay, you must also specify the gain. Again, you can construct it graphically by showing the gain in measure obtained over a period of time with a known command.
In both cases you also specify the sample duration and the displayed horizon.
You can import captured data as CSV into T2T-PID. This way you can discover the defining parameters for your process while comparing the result with the actual behavior of your process. Try to obtain the closest possible fit between the simulated measure and the curve with data from your file.
In order to be able to use this function, the file must at least contain data for the measure and the command. (data for set point is helpful, but optional), with a constant sample duration.
The file will have:
You can open CSV files as e-mail attachments, or as links in Safari. A sample set is provided here
The recommended workflow starts with the process. Make a copy of one of your processes or one of the 2 included process templates.
The templates themselves are just that: templates. As such, you cannot change their title nor add multiple PID sets. Make a copy, give it an appropriate title and start working with it!
Don't worry if you delete the templates: they will always return to the list.
To change a title, just touch it for a while. Depending on the context, the keyboard may come with a few extra buttons to insert a filename, value name or timestamp.
You can continue with a copy of an object by hitting the 'copy' icon on the title bar. You will be given the chance to enter a new title or cancel the operation.
A copy of a PID set will always belong to the original process. That process will be the parent of all its PID settings. If a process was defined using a CSV file, likewise it's copies will belong to that same CSV entry. CSV entries themselves do not have a parent.
Note that copying an object will not copy its children. If you copy a process, it will start without PID settings, even if the original process had several.
In all lists, either those from the main menu or the intermediary lists between screens, you can freely delete items. Simply swipe to the right. A confirmation will asked. Note that deleting certain objects will delete others too: delete a process and gone are its PID settings. Whenever any of these cascaded deletes involves two or more objects, an extra confirmation will pop up.
To locate your CSV data, processes and PID settings, you can use the alphabetical lists available through the main menu. A helpful icon, rendered with your settings, will serve as a visual clue.
Once you opened an item, a button on the right of the title bar will give access to the next step: after CSV data comes the process, and processes lead to the PID settings. When several objects are available, an intermediary list will be presented.
Backward navigation will adapt to the situation. If you select some PID setting from the list, the 'back' button will bring you to it's process, and next to its CSV data, should it exists.
This flexible navigation allows you for instance to pick a PID setting from the list, yet to navigate up to the process to make some changes or find the other associated PID settings.
Several elements occur or different screens. We introduce them here.
The upper half of the screen will contain the graphs related to the command, whereas the lower half will show the measure and setpoint graphs. On the right hand of the screen, you will find a little slider with arrows. Simply drag it to readjust the screen to your needs.
When a zone would become too small to display in a meaningful way, it will disappear altogether. In that case, you can also tap the arrow, to quickly alternate between display modes. (On the iPhone, this will be the default mode for landscape orientation)
The power of T2T-PID lies in its intuitive touch interface. Touch lines, drag them and watch values and graphs change. Automatic limits (such as: no 'end' before 'start', no 'max' lower than 'min') will prevent impossible values.
When you have to enter a precise value, tap the numerical label rather than the line representing it. The data-entry tool will pop up.
This tool serves as a slider or (intelligent) keyboard. Double-tap its title to switch modes.
When minimum or maximum values are knows, they will be shown and enforced.
You will often need to move the tool around, to be able to see what is going on. Easy: grab its title and move it anywhere you want.
In slider mode, you will also see some buttons: <, >, <<, >>. They allow you to change the value in small steps (the value's precision) or larger steps (ten times this precision). Hold down the button for repeating action.
The slider's min, increment and max values are shown below. You can go change them after touching them for a moment. Save your custom values for this precise case, all sliders of the same type or restore defaults. Note that actual value min/max constraints will still apply.
In number mode, an adapted keyboard will appear. Use the arrow-buttons and the <X (backspace) to move around the cursor.
Hint: double-tap the decimal point to move the cursor right after the dot.
Use 'C' to clear your value.
Hint: if a minimum value exists, double-tapping 'C' will set the value to this minimum.
Hint: you can close the tool with the little red 'x'. But in fact, you can just tap anywhere outside the tool.
A special cursor (initially positioned at time=0) can be dragged around to find out the values of different graphs at the time of your choice.
The horizon is the duration of the simulation shown. As it will always show at the right, 'dragging' it will instead reduce the amount of time displayed. To increase it again, use the data entry-tool.
While experimenting with different values, you will often find yourself with an incomplete display. Simply double-tap anywhere on the graphs to have the revert to optimal zoom.
Hint: Every time you select an object, it will come to the front. Handy to read the labels of values that may be hidden behind other labels.
Hint: Whenever two lines are at the exact same position, they will alternatively get selected. Should two values be very close, but not equal, just hit them from the right side.
In the CSV area, you will prepare your CSV data to serve the purpose of defining a process. Hit the different curve labels to select the correct column from your file. Select one for command, one for measure, and if you want, one for the setpoint.
You must also change “process type: unknown” and indicate if we're dealing with a stable process or an integrating process.
Only when you have made these choices will the 'Process' button on the title-bar become active.
Note: the sample duration, defined in the file, is only shown for your information and cannot be changed.
Note: While it is possible to correct the process type later on, you will confuse existing processes created with this CSV before. A warning will be issued whenever you first access any of the affected processes afterwards.
Two vertical lines, “start” and “end” allow you to limit the use of the CSV data to the period of your choice.
It is possible to create copies of your CSV element. This could be useful in case the same file contains data for different values (and hence different processes), or if the value behaves very differently over time and you need to define different processes for different situations.
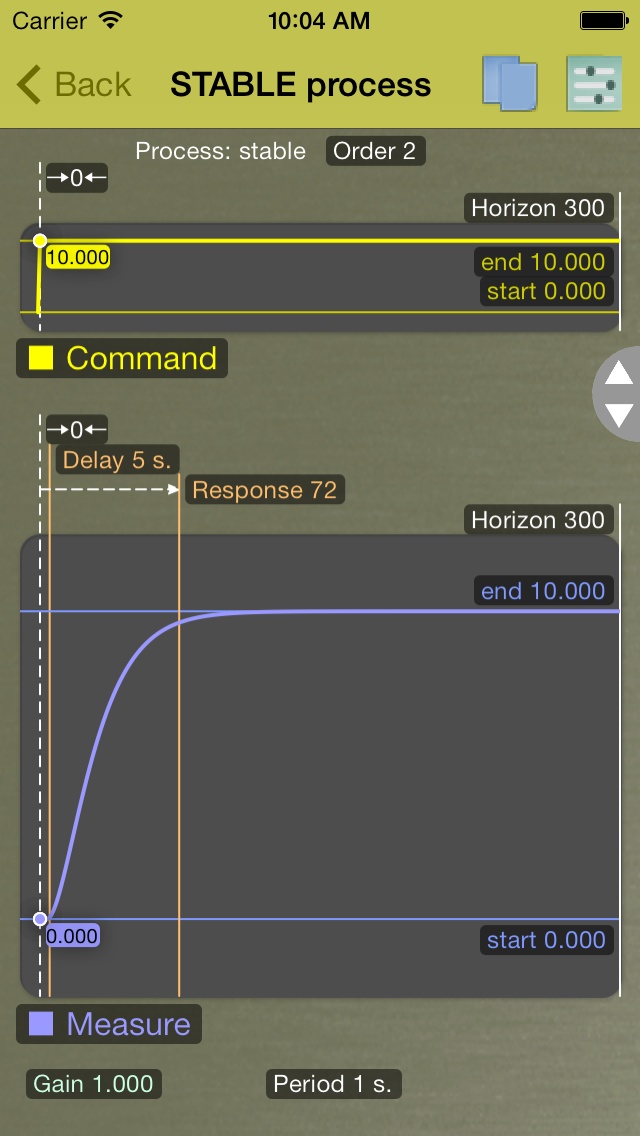
The Process area comes in two different flavors, one for stable and one for integrating processes.
In both cases, you can pick and set a range for the command as well as the measure. You can also set the process delay.
For stable processes you can alter (near the top of the screen) the order of the function used to model the measure. Default value is 2.
To describe the stable process, you also need to know the response time, that is the time the measure will take before approaching the requested setpoint.
You define the integrating process by indicating the time interval needed for a specific interval in measure to occur for a given command. This duration is independent from the process delay. That is, you can freely alter the delay, as the interval will move along.
When you alter the gain directly (lower left), the value of the maximum final command will be altered automatically.
When defining a process with the help of CSV data, the curves from this file will be displayed. A measure will be simulated using your parameters together with the command from the file. A delta value (lower right) will show the average absolute difference between the simulation and the real measure from the file data.
Note: while using CSV data you cannot set the horizon beyond the actual duration of the selected file data.
Upon first entry, default values for the controller will be proposed, depending on the characteristics of your process. Note that these are not necessarily the best possible values.
The simulation will occur:
You will be able to freely alter P, I and D settings for your controller and observe how they influence the simulation of both command and measure.
As soon as the process turns stable, and the measure will remain inside a +/- 5% band around the setpoint, a green line will indicate the response time. (Between brackets will be mentioned the number of oscillations that still take place before this point in time)
The art of controller tuning consists of finding those values for P, I et D that reduce this response time while maintaining reasonable process behavior. During your search you might find it useful to alter the horizon to allow for the best observations.
It is possible to limit the controller output with minimal and maximal output values.
You can simulate noise on the measure and observe how it will influence your controller. A filter allows you to attenuate the negative effects. As a result, you will need to alter your PID settings to find a new optimal setting.
You can also choose the controller scheme:
Default units are absolute values, so-called 'engineering units'. Should your controller calculate differences as percentage over the scale of measures, you can enter this scale minimum/maximum values.
© 2013 ranavision bvba - Apple, iPad, iPhone, iPod touch, and iTunes are trademarks of Apple Inc., registered in the U.S. and other countries.